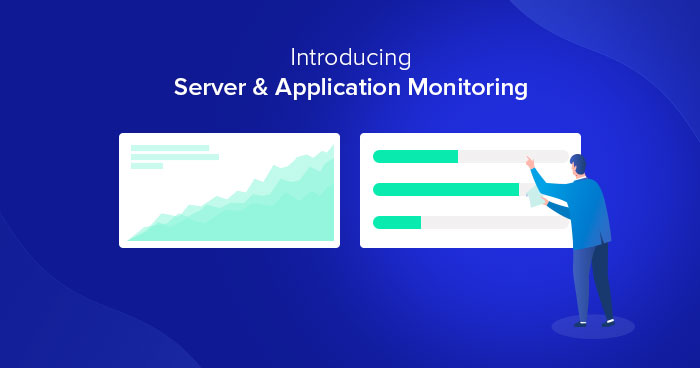
You can now monitor your Server & Application resources at a glance on the Cloudways Platform through the newly added tabs in the Monitoring sections.
Cloudways users regularly propose useful suggestions on our feedback forum that helps us improve our platform. Eventually, everyone benefits, and that’s why we keep an eye out for high-impact recommendations and queue them up in our feature improvement/addition pipeline.
One of the most requested Paas cloud services features was the ability to view server resource utilization (CPU, Bandwidth and RAM) and application wise disk usage in an easy-to-understand graphical and numerical representation. In other words, you want to monitor server resources at a glance!
For our readers wondering why you may need to monitor server resources, here’s the main reason: your server resources have limits, and once those limits are hit, your sites may start to underperform. Thus, keeping a vigilant eye on server resource usage (available disk space, in particular) allows you to take timely action before your server and the hosted websites start to slow down.
Here’s what one of our users wrote while asking for on-platform resource monitoring:

This is pretty much in line with the bulk of the requests we received through various channels such as Cloudways Feedback Forum.
And so we set our sights on providing our users with a tab that presented server resource usage info in an easy to read visual format.
Introducing the Summary Tab
Our engineers came up with the Summary tab in the Monitoring section under Server Management. Here’s a look at the new tab, now available to all platform users:
Before we dive into the overview of what you’ll find under the newly added Summary tab, let’s take a look at what you can see in the redesigned Details tab.
The New Details Tab
Under the Details tab, you can see how your server resources have been utilized over time. The tab presents you with all the details you need to make informed decisions about server management and upgrades.
There are sixteen (16) metrics that cover almost every important server resource utilization details. The information could be viewed over the range of up to 6 months ago.
Here are a few of the most important metrics you can keep an eye on under the Details tab:
i. Idle CPU
The Idle CPU metric displays the volume of idle/free CPU or CPU consumption. A lower number on this graph indicates higher CPU consumption, and in case your numbers are dwindling on 20% or less, you probably need to upgrade your server.
ii. Free Disk
Free Disk shows you the free disk space (in GBs) on your server. Once you’ve used 95% or more of your disk you’ll receive a notification from the CloudwaysBot, so don’t worry about running out of free disk without knowing. However, if you see that your disk space is running low (2GB or below), you should consider upgrading your server.
iii. Free Memory
Free Memory shows you the unused/free volume of your RAM (in MBs). As is the case with Idle CPU, a lower number on the graph indicates higher RAM usage which can ultimately affect how your applications operate. In case your RAM is dwindling on 100MB or below all the time, you can simply choose an application that’s equipped with higher RAM, CPU & Disk usage.
There are several other important metrics like Monthly Bandwidth, Autohealing Restarts, and MySQL Connections that you can keep track of in the details tab, so go ahead and explore it to see what metrics can help you improve your servers.
However, the star of the show today is the new Summary tab (and the Disk Usage under Application Management), so let’s get back to it and see how it can help you can keep tabs on your server resources without needing to go into details in the graphical form!
The Summary Tab
Under Details, you’ll find in-depth information. Under Summary, though, you’ll find all the important server utilization info at a glance – something our users have found very useful for a quick check on server performance.
It summarizes four major categories that are crucial in helping you keep tabs on server performance and decide whether it’s time for an upgrade.
i. RAM Usage
While it’s obvious that you can view the RAM usage on your server under this label, the important thing to note is that the stat updates every 5 minutes. However, you can refresh the page anytime to reload and get the latest stat on the spot.
For a detailed understanding of RAM usage and to determine its trend, you can refer to the Details section, of course.
ii. CPU Usage
Info on your current CPU utilization is present under CPU Usage. You can refresh the page to view the latest CPU utilization percentage and it updates every 5 minutes automatically as well.
If you want to view the CPU usage over a period of time to determine the trend, you can always refer to the Details tab for an in-depth understanding.
iii. Bandwidth Usage
You can view the bandwidth consumption for both incoming and outgoing traffic under Bandwidth Usage. You can reload the page to refresh these stats, otherwise, they automatically refresh every 30 minutes.
Do keep in mind that the allocated bandwidth resets on the first day of every month (determined by server time in the UTC timezone).
iv. Disk Usage
You can see your disk space consumption under this heading, of course, at the mentioned time stamp, and it updates every 30 minutes. The stats include database and system files, application files, etc., for DigitalOcean, Vultr, and Linode.
However, in the case of AWS or Google’s GCE server, application web files and database have separate disks, and each will be shown with its own separate usage stats.
Stats on DigitalOcean secure servers with BlockStorage, though, will only show the BlockStorage space where the application web files, database, and other master user workspace are stored.
You can host multiple applications on a server, and you may want to know which application is using how much of the available disk space. Hence, you’ll find a dropdown in Disk Usage to view the disk usage of each application on the recorded timestamp. This stat updates every 24 hours.
Now if you want to view application disk usage along with a breakdown of top-level webroot and database disk space usage, you can always select the app to view things in detail, or you can directly go to the Applications tab on top, select the application you want to view and select Disk Usage under Application Management.
This is a newly added section under Application Management and gives you a complete breakdown of disk usage by each application.
All these 4 metrics are supposed to give you a summary of what’s happening with your server, reducing the dependency on the too-much detailed and somewhat technically advanced metrics in the details section.
Login to your Cloudways account and explore the newly added Summary and Disk Usage tabs in the Monitoring section. Once you do, don’t forget to leave your feedback on this post if the new addition has made it easier for you to monitor your servers!
Owais Khan
Owais works as a Marketing Manager at Cloudways (managed hosting platform) where he focuses on growth, demand generation, and strategic partnerships. With more than a decade of experience in digital marketing and B2B, Owais prefers to build systems that help teams achieve their full potential.