At Cloudways, we believe in working with our customers to solve the issues that affect business growth and customer satisfaction. That’s why over the years we have built tools, added features and introduced add-ons that make a complex or otherwise time-consuming task as simple as possible.
We believe in empowering you, so you can move your dreams forward. The Cloudways Platform is designed to give you power, and a better understanding of your web hosting.
Our Priority#1 for 2019 is “Delightful Support”, and besides several initiatives including scaling and doubling down the Support team, one of the important focus was to create tools/features to help our Support team and Customers debug issues faster.
Besides getting customer feedback for having application-level visibility, we were seeing the repetitive pattern in performance and troubleshooting related queries and saw the need for a tool/feature to help to be more efficient with these.
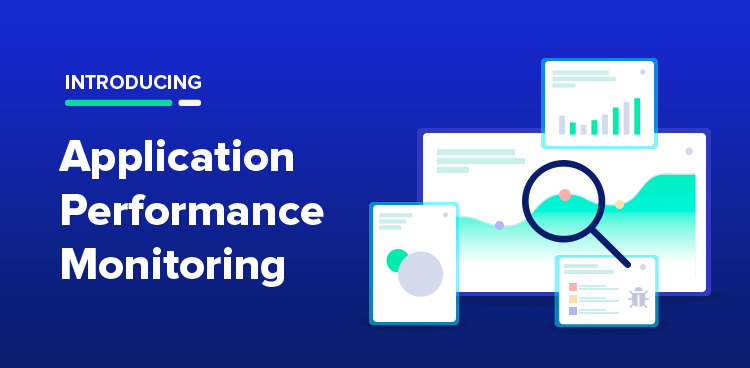
We released an internal version of APM two months back and found it really helpful. We are releasing its public version to let customers troubleshoot/debug Application-specific issues and if they need help, they can contact 24/7/365 always responsive Support to guide them using these tools.
How To Access APM
To access application performance monitoring, navigate to Server Management > Monitoring. Click “Application Wise Details” to expand it and display a summary of how much each application on your server is utilizing server resources like CPU, Memory and Disk Usage.

What Action Can You Take With This Information
The summary is a good start to knowing which websites are the most server resource intensive. With this information, you can make clear decisions about websites that demand more resources. Maybe you can clone the most resource-hungry website to another server, or just scale the current server.
When you click an application under “Application Wise Details”, you will be taken to that particular app’s Monitoring tab. This tab contains details about traffic, PHP requests, disk usage per folder, database queries and cron jobs that are running.
Alternatively, you can access APM directly via the Application Management screen under the Monitoring tab.
APM > Traffic
The first section is “Traffic”. It contains key statistics about traffic, IP requests, bot traffic and the status codes that your application has returned during the time interval you selected. The first tab, “IP REQUESTS” will help you check which IP addresses you are getting the most traffic from, and on which URLs.
If you are seeing an abnormally high number of requests from a single IP address on multiple URLs or a single URL, then this IP is eating up server resources. This can cause lower response rates to other genuine IP requests. You can contact our support for more details or add a WAF on your application to block malicious IP requests.
Under the “BOT TRAFFIC” tab, you will see which bots are crawling your website. If you don’t recognize a bot, or you know that it’s malicious and you don’t want it crawling your website, then you can easily block that bot by adding a rule in your robots.txt file.
For Example, to block oBot, add the following rule in your robots.txt file
//Block access to the entire website
User-agent: oBot
Disallow: /

//Block access to admin folder
User-agent: oBot
Disallow: /admin
The third tab you will see is “URL REQUESTS”. In this section, the most requested URLs will be listed. By expanding details of each URL, you will see the top IP addresses that are requesting a particular URL.
If you see your login page is requested by a lot of IP addresses multiple times and you don’t recognize those IP addresses, then it will be a good decision to only whitelist IPs that you trust. This protects your websites from potential brute force attacks.
The fourth and final tab is “STATUS CODES”. Here you can see the status codes that your server is returning to the requests it is receiving.
See a lot of 200 status codes? That means everything is in order. If you see 500 or 503 errors, then your server is experiencing some downtime. Contact our Support Team if you want help investigating an issue.
APM > PHP
Identify the most requested PHP pages under the “REQUESTED PAGES” tab. Through this tab, you can identify which PHP pages are being requested and how much time it takes for a response to complete.
The next tab, “RUNNING PROCESSES”, will highlight the live PHP processes that are active within your application and how much resource (CPU, RAM, and Duration since live) a single process is taking. This tab can help you easily identify a resource-intensive PHP process.
The final tab “SLOW PAGES” will, as the name suggests, show you some of the slowest PHP pages that you have. The metrics Max. Time will report the peak time it took for the process to complete. Avg. Time will report the average across a selected time interval.
APM > Database
If you have a database-intensive application or website, then you will love this section. Under the “SUMMARY” tab you will be able to find the currently running SQL Queries and see how long they have been running and what is the type of command.
The next tab, “SLOW QUERIES”, will show the SQL queries with the highest execution time.
APM > Running Crons
Did you know you can easily create cron jobs within the Cloudways Platform? These cron jobs require resources when they are operational. Under the “Running Crons” section, you can check how much these crons are costing you in terms of CPU and memory.
APM > Disk Usage
Under this section, you will get summarized and detailed breakdowns of how much disk space a particular application is using. All the folders in your webroot will show their respective usage of disk space.
For databases, we have broken down the report to display the size of each database table. The report is sorted with the highest to lowest disk usage.
The “DETAILS” tab will display the disk usage information on a graph. This is a good way to know how disk usage has changed over a period of time (1 day to 6 months).
What’s Coming Next?
At Cloudways we have always taken customer feedback seriously to monitor large-scale Java and PHP distributed systems, and we have a contagious habit of improving our Platform. We are already working on displaying the PHP access logs and Apache logs in a user-friendly readable format within the Platform.
The motivation behind building APM into the Platform was to enable you, by keeping you informed about the usage stats of respective applications. This lets you make informed decisions. Previously, we had Server Monitoring that helped display the usage of server resources over time. APM extends monitoring to the application level, thus helping a great deal. Now you can understand multiple applications hosted under a single server.
Owais Khan
Owais works as a Marketing Manager at Cloudways (managed hosting platform) where he focuses on growth, demand generation, and strategic partnerships. With more than a decade of experience in digital marketing and B2B, Owais prefers to build systems that help teams achieve their full potential.